I know you can set the "negative" color for a range, but that is just if the numbers go under the hard-set 0. What I'm looking for is to make it so that if the first value of the point goes under the second value of the point, then that is considered "negative", rather than a constant across the whole series.
My specific goal is to compare data for two years, so the point.0 would be year1 and point.1 would be year2. So when the year2 is doing better than year1, that section would be green. But when year2 is lower than year1, that section would be red.
This way I can quick glance at a lot of data and instantly see where the problem areas are.
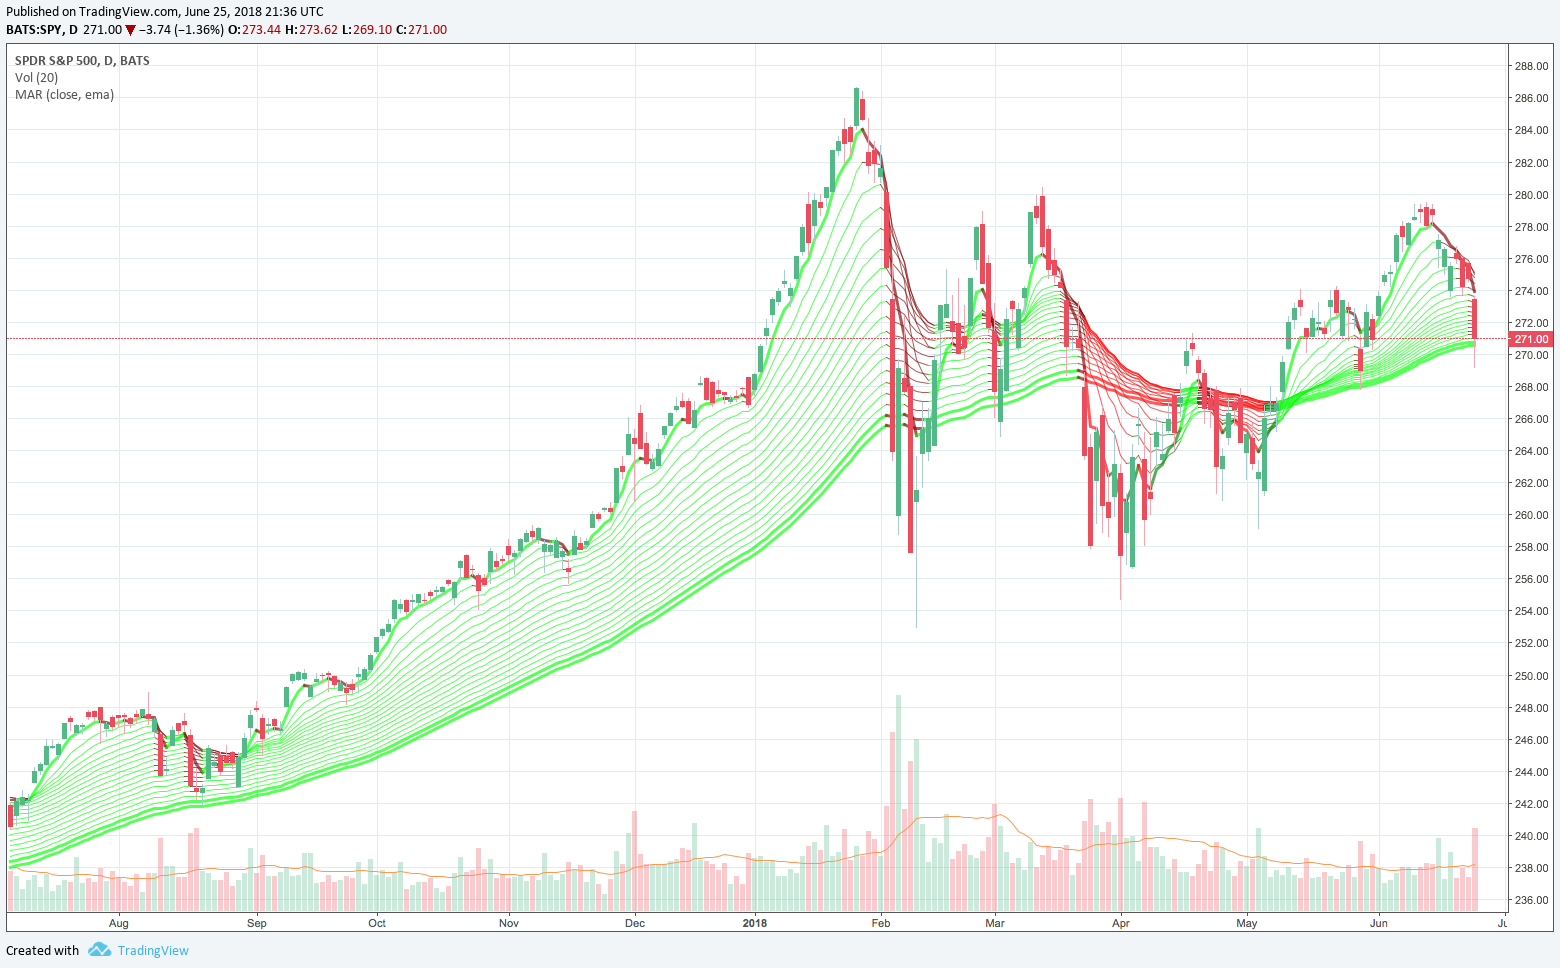
Sort of like when glancing at a chart like this, but from different logic of what is red/green.
https://i.investopedia.com/image/png/15 ... 252018.png
thanks!
Re: Area Range sectional coloring
Hi gareth-ib,
Unfortunately, this feature is not supported now. However, you can post on Highcharts uservoice https://highcharts.uservoice.com/forums ... script-api page and if it gets enough votes we will add it in the next versions.
If you would like to have it now, please contact Black Label company (email: [email protected]). They are experts in charting highcharts, highstock and highmaps and deal with such a custom projects.
Black Label:
https://www.blacklabel.pl/
Kind regards.
Wojciech Chmiel
Highcharts Developer
Highcharts Developer
Re: Area Range sectional coloring
ooh I found someone else posted a request for this already 
https://highcharts.uservoice.com/forums ... values-are
https://highcharts.uservoice.com/forums ... values-are