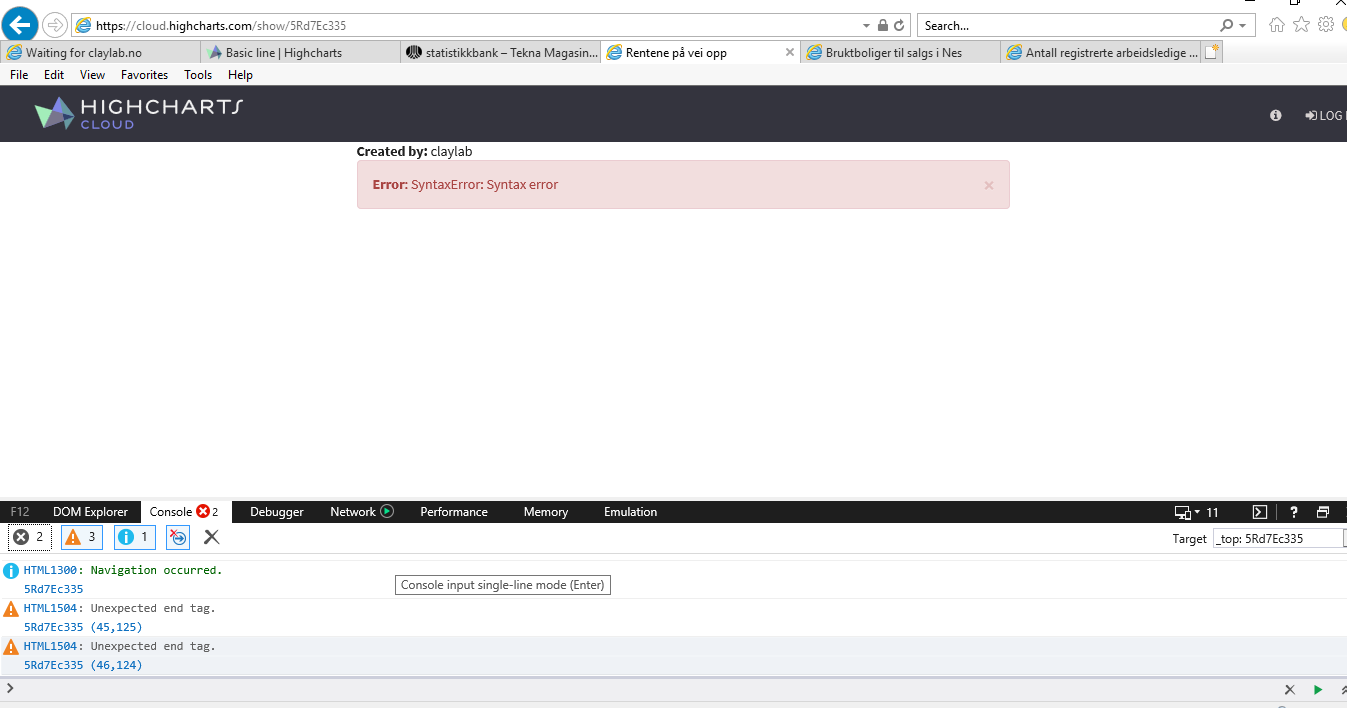
I use the cloud.highcharts.com GUI to create the charts.
For the chart
https://cloud.highcharts.com/show/5Rd7Ec335
The preview options tab shows this config (I have hidden the spreadsheet key in the config) -
Code: Select all
{
  "title": {
    "text": "Rentene på vei opp"
  },
  "subtitle": {
    "text": "Utlånsrente for rammelån med pant i bolig, gjennomsnitt for året."
  },
  "exporting": {
    "buttons": {
      "contextButton": {
        "menuItems": [
          "printChart",
          "separator",
          "downloadPNG",
          "downloadJPEG",
          "downloadPDF",
          "downloadSVG"
        ]
      }
    }
  },
  "chart": {
    "type": "line",
    "polar": false
  },
  "plotOptions": {
    "series": {
      "dataLabels": {
        "enabled": true,
        "style": {
          "color": "contrast",
          "fontSize": "11px",
          "fontWeight": "null",
          "textOutline": "1px 1px contrast"
        }
      }
    },
    "line": {
      "marker": {
        "enabled": false
      }
    }
  },
  "credits": {
    "href": "https://www.ssb.no/nasjonalregnskap-og-konjunkturer/artikler-og-publikasjoner/hoykonjunktur-i-sikte?tabell=360825",
    "text": "Kilde: SSB",
    "style": {
      "color": "#0000ff"
    }
  },
  "pane": {
    "background": []
  },
  "responsive": {
    "rules": []
  },
  "legend": {
    "enabled": false
  },
  "series": [
    {
      "name": "Utlånsrente, rammelån (nivå)5",
      "_symbolIndex": 0,
      "_colorIndex": 0
    },
    {
      "dashStyle": "ShortDot",
      "_symbolIndex": 1,
      "_colorIndex": 1
    }
  ],
  "yAxis": {
    "title": {
      "text": "Utlånsrenter %"
    }
  },
  "xAxis": {
    "plotBands": [
      {
        "label": {
          "text": "Prognoser"
        },
        "from": 5.5,
        "to": 2021,
        "color": "#eeeeee"
      }
    ],
    "type": "category"
  },
  "data": {
    "googleSpreadsheetKey": *******************",
    "googleSpreadsheetWorksheet": "7",
    "dataRefreshRate": false,
    "enablePolling": false,
    "startRow": 0,
    "endRow": 1.7976931348623157e+308,
    "startColumn": 0,
    "endColumn": 1.7976931348623157e+308
  }
}
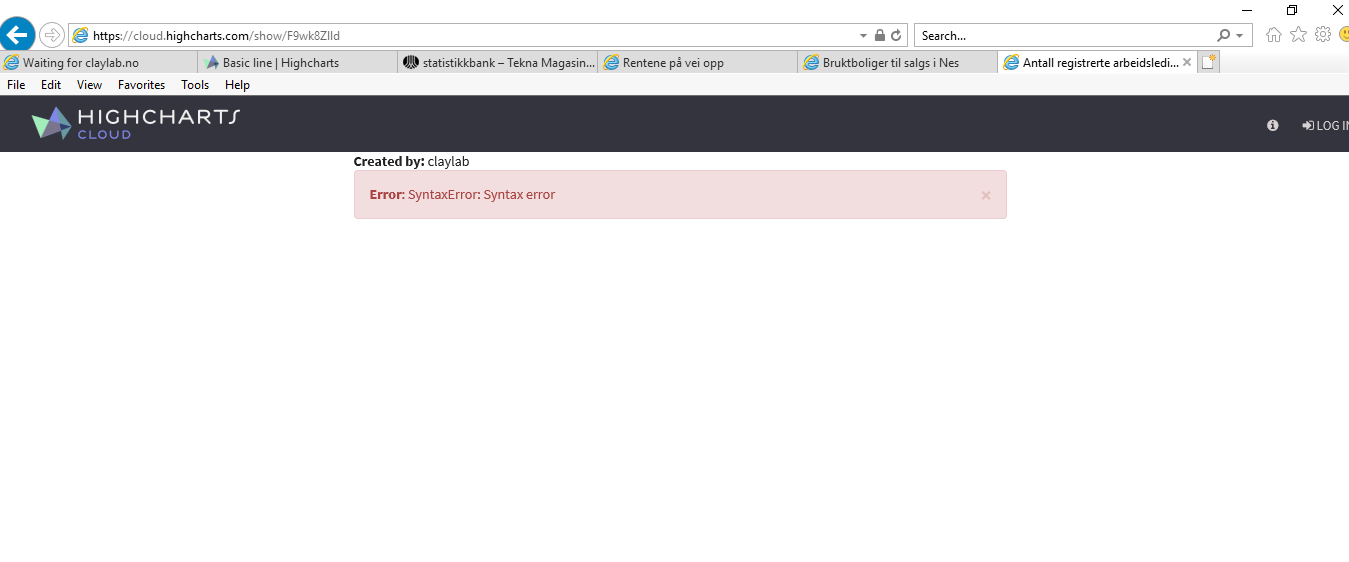
for the chart -
https://cloud.highcharts.com/show/F9wk8Zlld
Code: Select all
{
  "title": {
    "text": "Antall registrerte arbeidsledige sivilingeniørerer innen geofag, petroleum og metallurgi m.v."
  },
  "subtitle": {
    "text": " "
  },
  "exporting": {
    "buttons": {
      "contextButton": {
        "menuItems": [
          "printChart",
          "separator",
          "downloadPNG",
          "downloadJPEG",
          "downloadPDF",
          "downloadSVG"
        ]
      }
    }
  },
  "yAxis": {
    "title": {
      "text": " "
    },
    "max": 1000,
    "endOnTick": false
  },
  "series": [
    {
      "name": "Norge",
      "turboThreshold": 0,
      "_colorIndex": 0,
      "_symbolIndex": 0,
      "marker": {
        "enabled": false
      }
    },
    {
      "name": "Rogaland + Hordaland",
      "turboThreshold": 0,
      "_colorIndex": 1,
      "_symbolIndex": 1,
      "marker": {
        "enabled": false
      }
    },
    {
      "name": "Rogaland",
      "turboThreshold": 0,
      "_colorIndex": 2,
      "_symbolIndex": 2,
      "marker": {
        "enabled": false
      }
    },
    {
      "name": "Hordaland",
      "turboThreshold": 0,
      "_colorIndex": 3,
      "_symbolIndex": 3,
      "marker": {
        "enabled": false
      }
    }
  ],
  "tooltip": {
    "shared": true
  },
  "credits": {
    "href": "",
    "text": "Kilde: NAV<br />NAV oppgir ikke eksakt tall for arbeidsledige under fire av personvernhensyn, og i slike tilfeller er det i grafen forutsatt tre.",
    "position": {
      "y": -20
    }
  },
  "xAxis": {},
  "pane": {
    "background": []
  },
  "responsive": {
    "rules": []
  },
  "plotOptions": {
    "series": {
      "animation": false
    }
  },
  "data": {
    "csv": "\" Region\";\" Norge\";\" Rogaland + Hordaland\";\" Rogaland\";\" Hordaland\"\n\" Jan '12\";25;6;3;3\n\" Feb '12\";23;6;3;3\n\" Mar '12\";27;10;6;4\n\" Apr '12\";24;9;5;4\n\" Mai '12\";25;10;7;3\n\" Jun '12\";20;9;6;3\n\" Jul '12\";18;8;5;3\n\" Aug '12\";23;11;8;3\n\" Sep '12\";25;10;7;3\n\" Okt '12\";23;10;7;3\n\" Nov '12\";20;7;4;3\n\" Des '12\";21;8;5;3\n\" Jan '13\";26;8;5;3\n\" Feb '13\";27;9;6;3\n\" Mar '13\";24;8;5;3\n\" Apr '13\";32;11;8;3\n\" Mai '13\";30;12;9;3\n\" Jun '13\";30;8;5;3\n\" Jul '13\";35;12;9;3\n\" Aug '13\";31;10;7;3\n\" Sep '13\";32;11;8;3\n\" Okt '13\";23;11;8;3\n\" Nov '13\";27;10;7;3\n\" Des '13\";27;10;7;3\n\" Jan '14\";29;13;10;3\n\" Feb '14\";38;17;14;3\n\" Mar '14\";53;21;14;7\n\" Apr '14\";63;29;21;8\n\" Mai '14\";75;43;32;11\n\" Jun '14\";87;43;30;13\n\" Jul '14\";106;53;33;20\n\" Aug '14\";111;58;35;23\n\" Sep '14\";139;76;47;29\n\" Okt '14\";153;83;53;30\n\" Nov '14\";172;98;65;33\n\" Des '14\";202;118;74;44\n\" Jan '15\";295;164;99;65\n\" Feb '15\";316;176;109;67\n\" Mar '15\";364;198;116;82\n\" Apr '15\";414;218;128;90\n\" Mai '15\";451;237;145;92\n\" Jun '15\";492;272;173;99\n\" Jul '15\";521;287;191;96\n\" Aug '15\";546;292;196;96\n\" Sep '15\";591;330;230;100\n\" Okt '15\";632;355;239;116\n\" Nov '15\";672;374;248;126\n\" Des '15\";698;395;262;133\n\" Jan '16\";823;442;301;141\n\" Feb '16\";838;445;306;139\n\" Mar '16\";851;462;318;144\n\" Apr '16\";879;489;336;153\n\" Mai '16\";863;484;328;156\n\" Jun '16\";914;518;356;162\n\" Jul '16\";945;522;351;171\n\" Aug '16\";932;510;343;167\n\" Sep '16\";918;501;329;172\n\" Okt '16\";961;527;347;180\n\" Nov '16\";959;543;365;178\n\" Des '16\";966;542;359;183\n\" Jan '17\";976;538;370;168\n\" Feb '17\";932;495;339;156\n\" Mar '17\";856;451;304;147\n\" Apr '17\";840;440;301;139\n\" Mai '17\";746;390;264;126\n\" Jun '17\";714;365;242;123\n\" Jul '17\";735;385;267;118\n\" Aug '17\";667;353;243;110\n\" Sep '17\";587;314;213;101\n\" Okt '17\";561;295;196;99\n\" Nov '17\";501;259;174;85\n\" Des '17\";500;256;173;83\n\" Jan '18\";476;251;175;76\n\" Feb '18\";424;220;145;75\n\" Mar '18\";405;208;131;77\n\" Apr '18\";358;179;109;70\n\" Mai '18\";318;152;94;58\n\" Jun '18\";313;144;88;56\n\" Jul '18\";319;139;86;53\n\" Aug '18\";292;124;75;49\n\" Sep '18\";276;118;73;45\n\" Okt '18\";256;112;63;49\n\" Nov '18\";237;109;62;47",
    "googleSpreadsheetKey": false,
    "googleSpreadsheetWorksheet": false
  }
}
I am not sure what is wrong in the config. Any help will be great.
Thanks


